For years, building a chart on top of Defender for Endpoint telemetry meant one of two things: either you streamed the advanced hunting tables into a Log Analytics workspace and paid to ingest them twice, or you exported query results and built your dashboard somewhere else entirely.
That is no longer the case. The Advanced Hunting connector for Workbooks went generally available in the unified Microsoft Defender portal, announced alongside the workspace filter / multi-workspace experience in the Defender monthly news for July 2026. You can now point a workbook query step straight at the advanced hunting schema — DeviceProcessEvents, DeviceNetworkEvents, AlertEvidence and the rest — and visualize the result without any of that data ever touching your analytics tier.
This post walks through it end to end, and then gets to the part I actually care about: joining tables. A single-table bar chart is a nice demo. Correlating a process launch with the network connection it made ten seconds later is what makes this worth writing about.
Everything below was built and run in my own lab, against real Defender for Endpoint telemetry.
What you need first
- Microsoft Sentinel onboarded to the Microsoft Defender portal. The Workbooks blade lives under Microsoft Sentinel → Threat management → Workbooks, so if you are still working in the Azure portal you will not see this.
- At least Workbook contributor on the resource group holding the Sentinel workspace — workbooks are still Azure resources under the hood, even when you author them in the Defender portal.
- Devices onboarded to Defender for Endpoint that are actually generating telemetry. Obvious, but worth stating: if your lab is quiet, every query in this post returns an empty table and you will think the feature is broken.
Note what you do not need: you do not need the Defender XDR data connector streaming advanced hunting tables into your workspace, and you do not need data lake tier ingestion. That is the whole point.
Step 1 — Open Workbooks and create a new one
Navigate to Microsoft Sentinel → Threat management → Workbooks and hit Add Workbook.
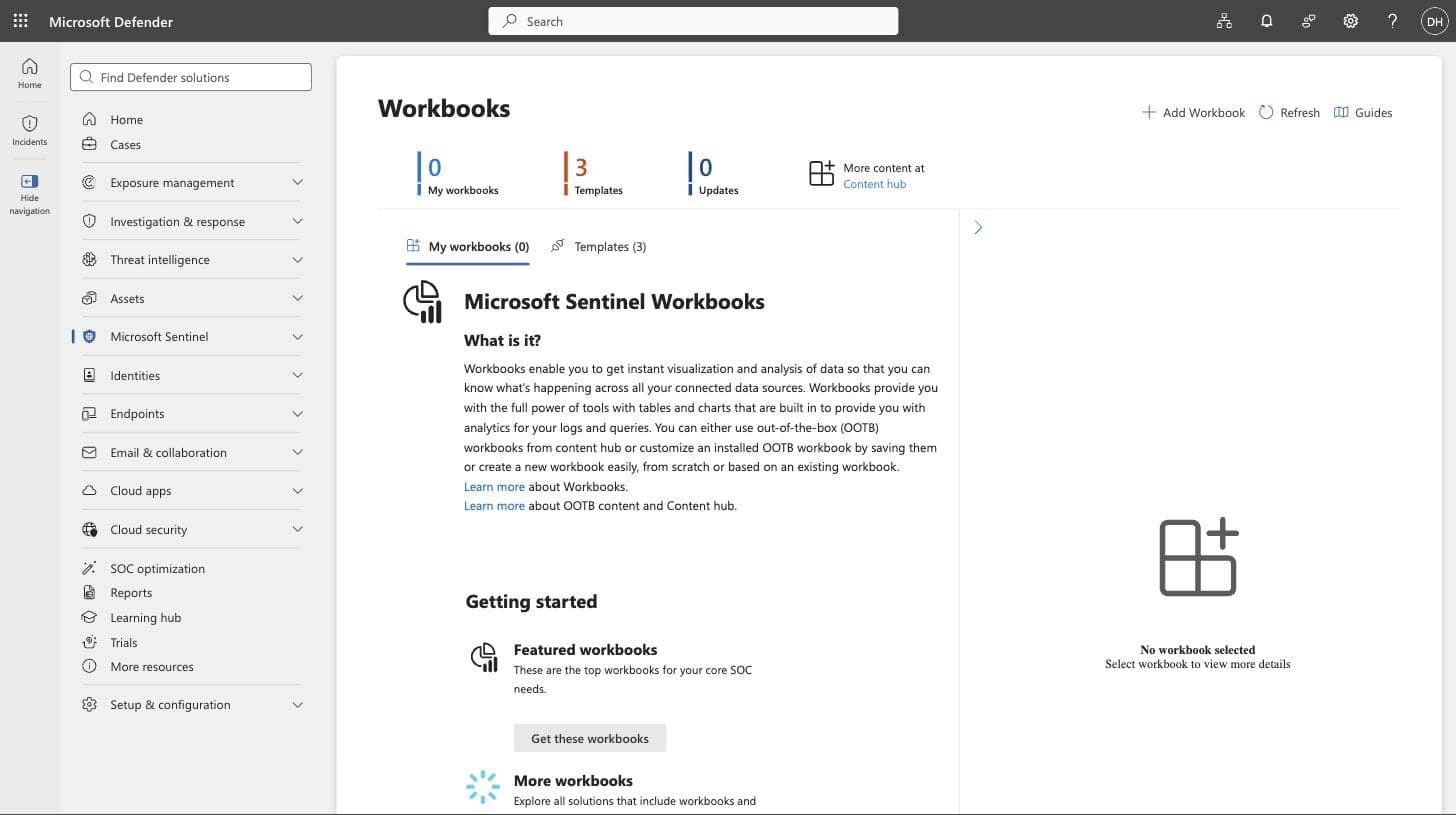
The new workbook opens in view mode with a sample query. Click Edit to get into the editor.
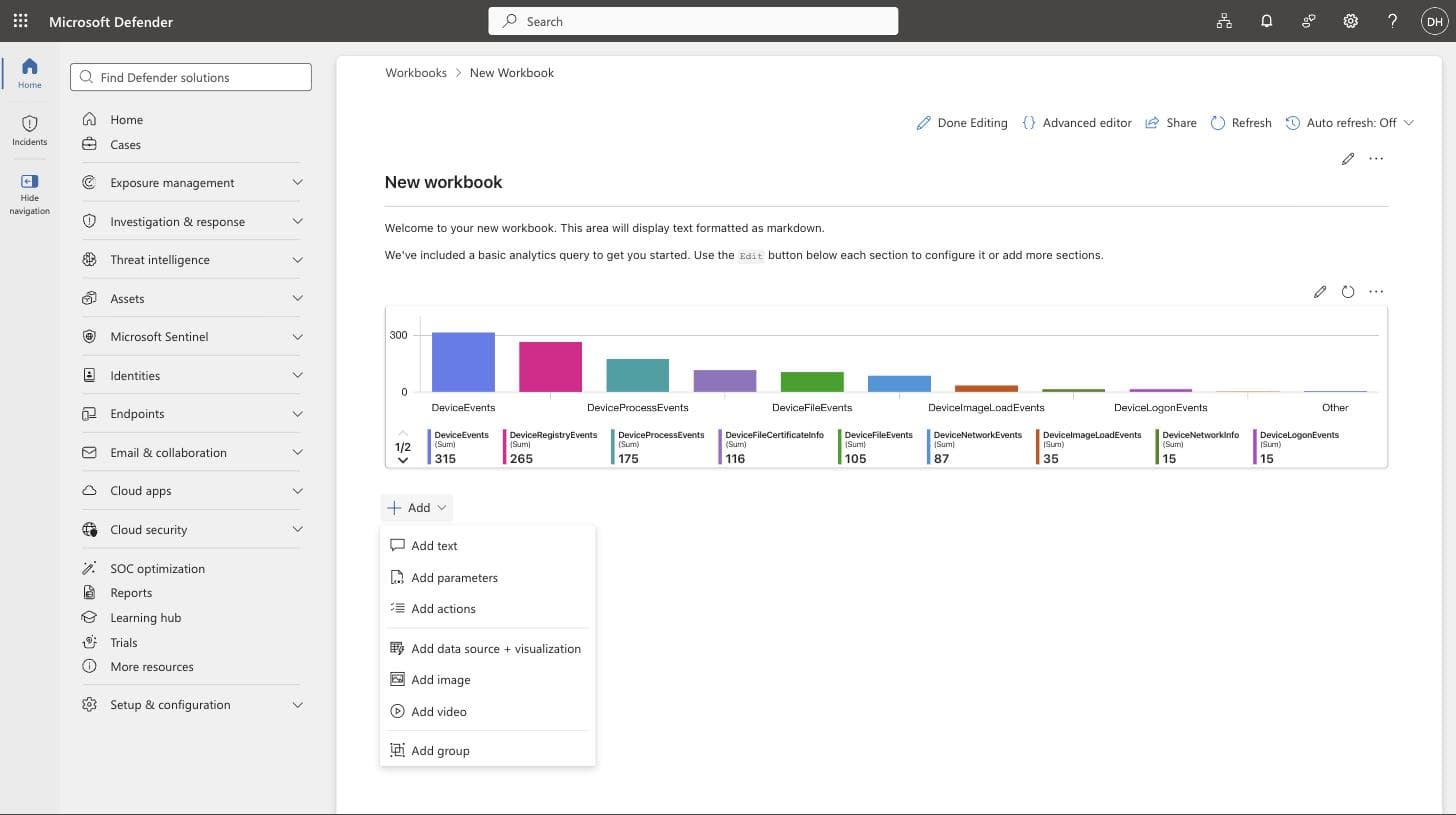
Step 2 — Add a query step
Click Add below the existing content, then Add data source + visualization.
Step 3 — Choose Advanced hunting as the data source
This is the new bit. Open the Data source dropdown. You will see the familiar list — Logs (Analytics), Logs (Basic), Azure Resource Graph, Azure Resource Manager, Change Analysis, Azure Data Explorer, JSON.
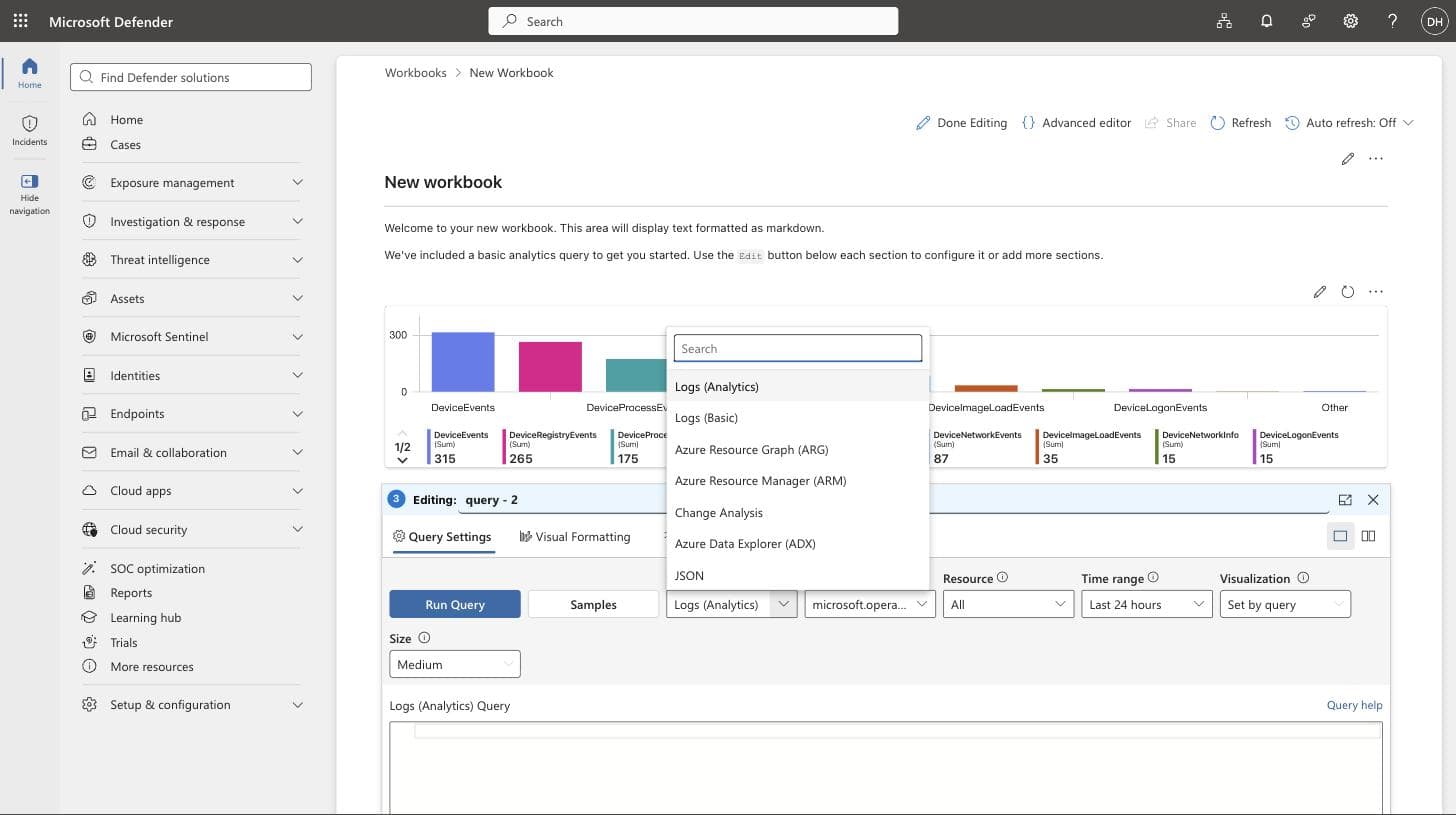
Advanced hunting sits below the visible portion of that list, so the fastest way to get there is to type hunt into the search box at the top of the dropdown.
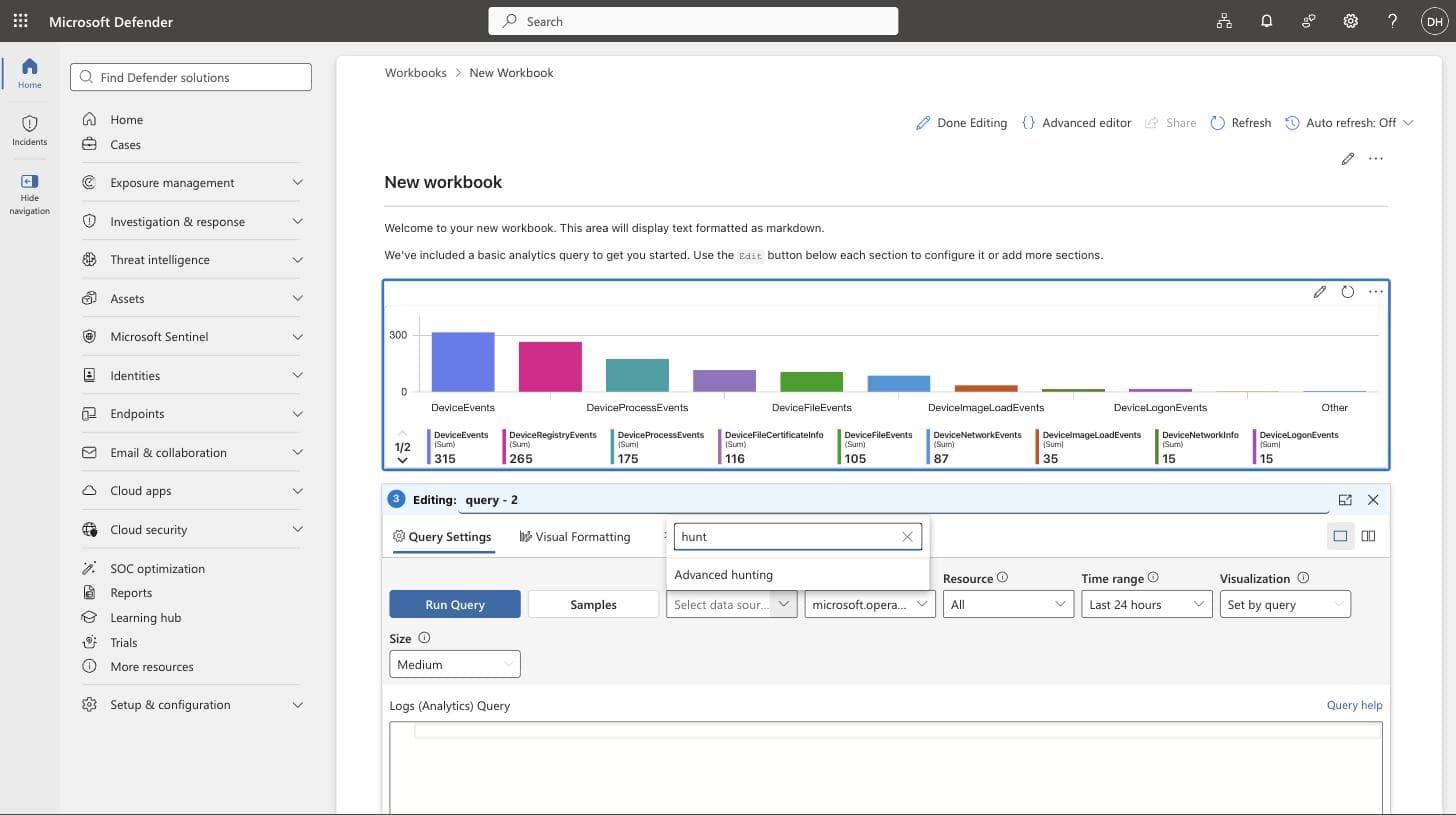
Select it, and the step reconfigures itself. The Resource type and Resource pickers disappear — they are meaningless here, because you are no longer querying a Log Analytics workspace. In their place you get a Workspaces picker, which is where the multi-workspace experience that shipped at the same time comes in.
Step 4 — Write a query that joins two tables
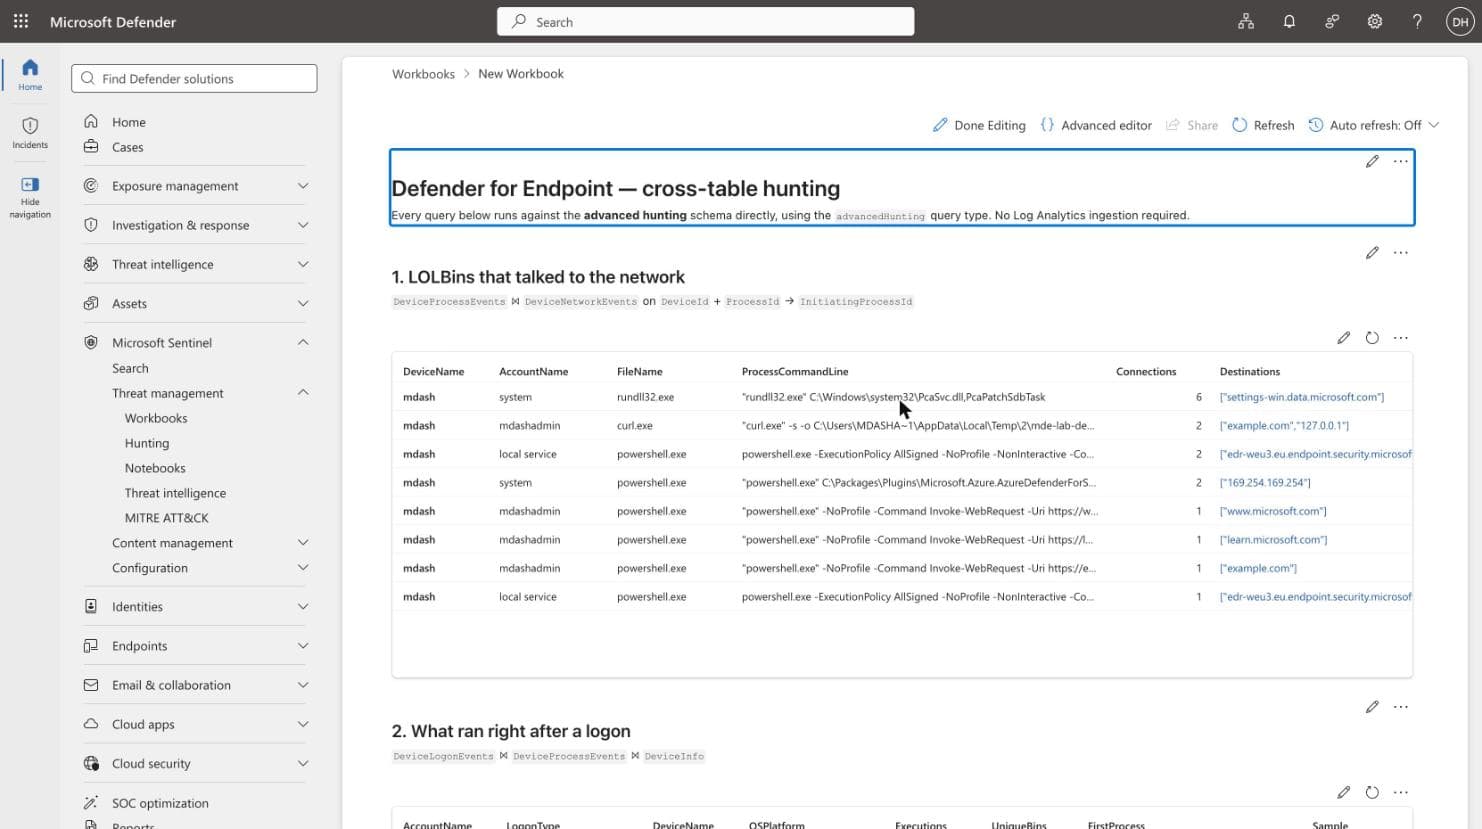
Here is the query I use as the smoke test for this feature. It answers a question every SOC asks: which living-off-the-land binaries actually opened a network connection?
let lookback = 7d;
let LolBins = dynamic(["powershell.exe","cmd.exe","wscript.exe","cscript.exe",
                       "mshta.exe","rundll32.exe","regsvr32.exe","curl.exe",
                       "certutil.exe","bitsadmin.exe"]);
DeviceProcessEvents
| where Timestamp > ago(lookback)
| where FileName has_any (LolBins)
| project DeviceId, DeviceName, ProcStart = Timestamp, ProcId = ProcessId,
          FileName, ProcessCommandLine, AccountName
| join kind=inner (
    DeviceNetworkEvents
    | where Timestamp > ago(lookback)
    | where ActionType == "ConnectionSuccess"
    | project DeviceId, NetTime = Timestamp, InitiatingProcessId,
              RemoteUrl, RemoteIP, RemotePort
) on DeviceId, $left.ProcId == $right.InitiatingProcessId
| where NetTime between (ProcStart .. (ProcStart + 10m))
| summarize Connections   = count(),
            Destinations  = make_set(coalesce(RemoteUrl, tostring(RemoteIP)), 8),
            FirstContact  = min(NetTime)
        by DeviceName, AccountName, FileName, ProcessCommandLine
| sort by Connections desc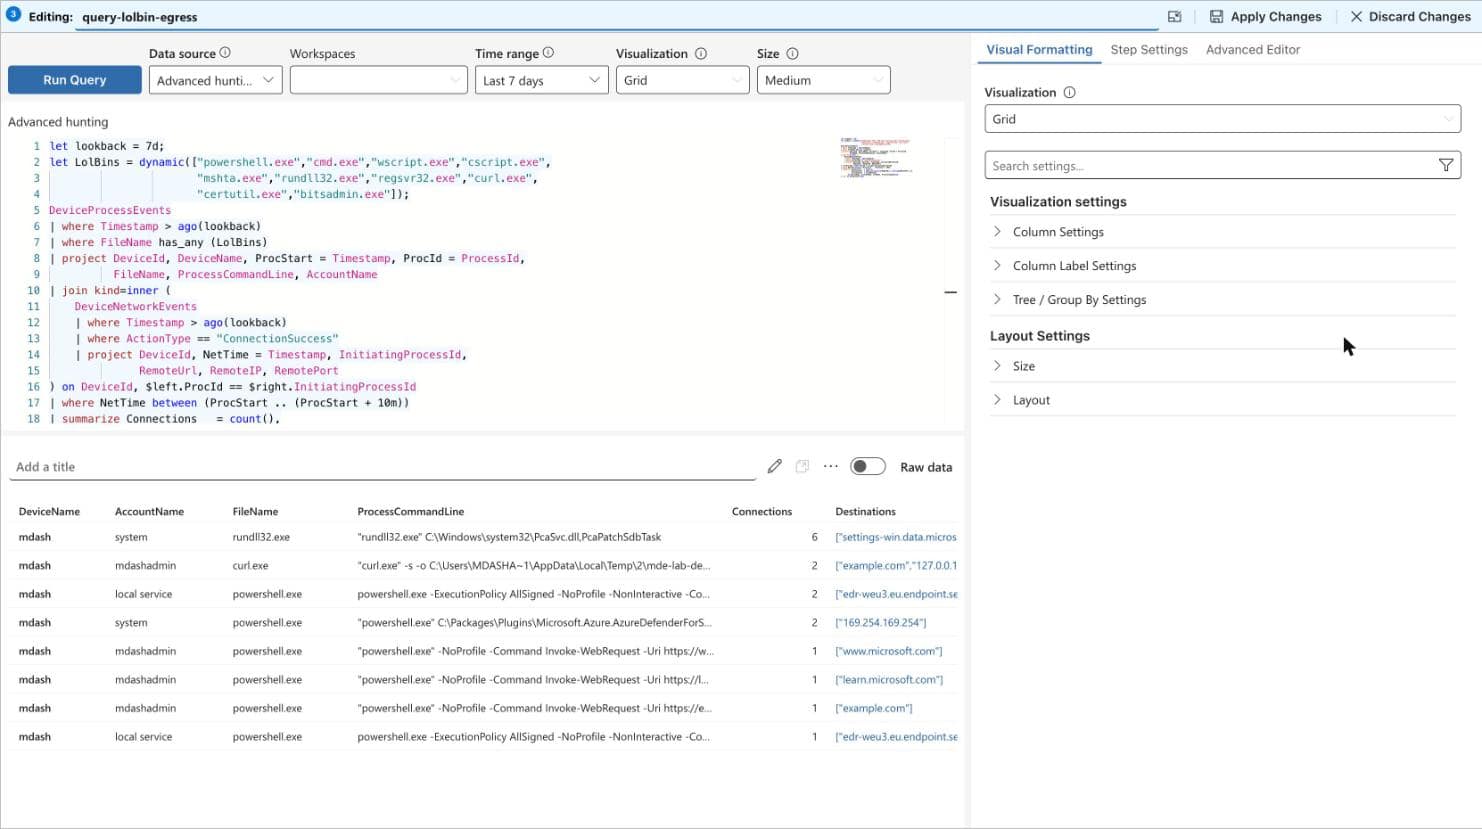
The join deserves a closer look, because this is where people get it wrong.
on DeviceId, $left.ProcId == $right.InitiatingProcessId is a two-key join. DeviceId scopes the correlation to a single machine — without it you would happily match a PowerShell process on one host to a network connection on another. The second key is the important one: DeviceProcessEvents.ProcessId is the PID of the process that was created, and DeviceNetworkEvents.InitiatingProcessId is the PID of the process that opened the socket. Matching those two is what ties the connection back to the specific process instance.
PIDs get recycled, which is why the between filter matters. Constraining the network event to a ten-minute window after process creation keeps a reused PID from producing a false correlation. Tighten or loosen that window to taste.
Everything else you would expect from KQL works: let statements, dynamic() literals, has_any, make_set(), coalesce(). This is not a reduced dialect.
Step 5 — Three more joins worth having
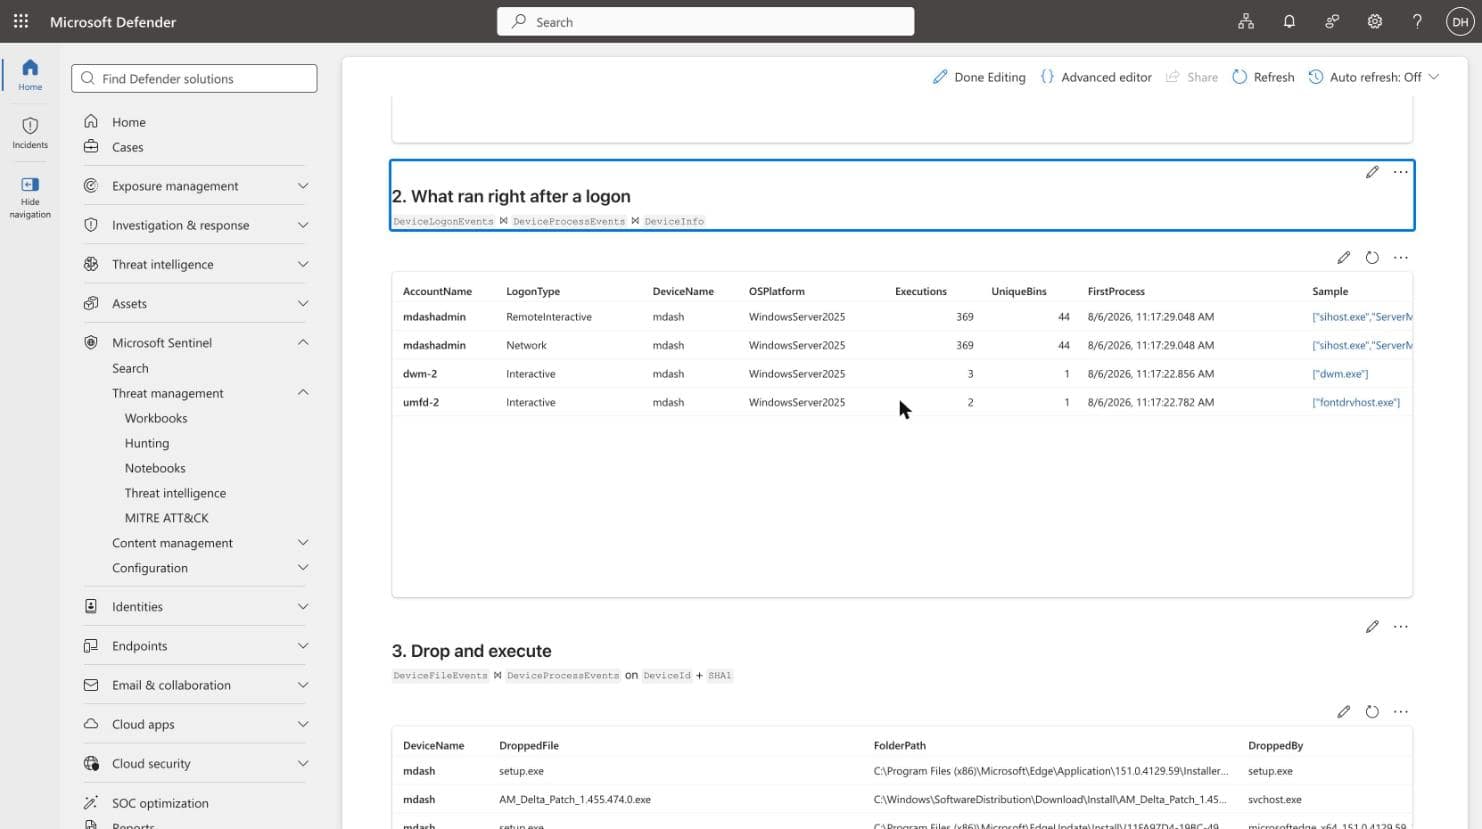
Logon → execution (three tables)
What did an account actually do in the fifteen minutes after it authenticated? This one chains three tables: logon events joined to process events on both DeviceId and AccountName, then enriched with device metadata via a left outer join.
let lookback = 7d;
let execWindow = 15m;
DeviceLogonEvents
| where Timestamp > ago(lookback)
| where ActionType == "LogonSuccess"
| where LogonType in ("Interactive", "RemoteInteractive", "Network")
| project DeviceId, LogonTime = Timestamp, AccountName, LogonType, RemoteIP
| join kind=inner (
    DeviceProcessEvents
    | where Timestamp > ago(lookback)
    | project DeviceId, ExecTime = Timestamp, AccountName,
              FileName, ProcessCommandLine
) on DeviceId, AccountName
| where ExecTime between (LogonTime .. (LogonTime + execWindow))
| join kind=leftouter (
    DeviceInfo
    | where Timestamp > ago(1d)
    | summarize arg_max(Timestamp, DeviceName, OSPlatform, OnboardingStatus) by DeviceId
) on DeviceId
| summarize Executions   = count(),
            UniqueBins   = dcount(FileName),
            FirstProcess = min(ExecTime),
            Sample       = make_set(FileName, 6)
        by AccountName, LogonType, DeviceName, OSPlatform
| sort by Executions desc
The arg_max(Timestamp, ...) by DeviceId inside the DeviceInfo subquery is not optional. DeviceInfo writes a row per device per reporting interval, so joining it raw would multiply your result set. Collapsing to the newest row per device first keeps the join one-to-one.
Drop and execute
A file lands on disk and then runs. Joining DeviceFileEvents to DeviceProcessEvents on DeviceId and SHA1 gives you the time between the two.
let lookback = 7d;
DeviceFileEvents
| where Timestamp > ago(lookback)
| where ActionType in ("FileCreated", "FileModified")
| where isnotempty(SHA1)
| project DeviceId, DeviceName, DropTime = Timestamp, DroppedFile = FileName,
          FolderPath, SHA1, DroppedBy = InitiatingProcessFileName
| join kind=inner (
    DeviceProcessEvents
    | where Timestamp > ago(lookback)
    | where isnotempty(SHA1)
    | project DeviceId, ExecTime = Timestamp, SHA1,
              ProcessCommandLine, ExecAccount = AccountName
) on DeviceId, SHA1
| where ExecTime > DropTime
| extend MinutesToExecution = datetime_diff('minute', ExecTime, DropTime)
| project DeviceName, DroppedFile, FolderPath, DroppedBy, ExecAccount,
          DropTime, ExecTime, MinutesToExecution, ProcessCommandLine
| sort by MinutesToExecution asc
Joining on the hash rather than the filename is deliberate — it survives the file being renamed between the write and the execution, which is exactly the case you want to catch.
Be warned that in a healthy environment this query is dominated by legitimate software updates. In my lab the top of the list is Edge installers and Defender platform updates. That noise is the point: get familiar with what normal looks like before you build a detection on it.
Alert triage with evidence
Finally, a join across the alert tables rather than the raw device tables. AlertInfo holds one row per alert, AlertEvidence holds one row per entity attached to that alert. Joining them and folding in DeviceInfo gives you a triage table with the affected device in the same row as the alert.
let lookback = 30d;
AlertInfo
| where Timestamp > ago(lookback)
| where ServiceSource == "Microsoft Defender for Endpoint"
| project AlertId, AlertTime = Timestamp, Title, Severity, Category
| join kind=inner (
    AlertEvidence
    | where Timestamp > ago(lookback)
    | where isnotempty(DeviceId)
    | project AlertId, DeviceId, EntityType,
              EvidenceFile = FileName, RemoteUrl, AccountName
) on AlertId
| join kind=leftouter (
    DeviceInfo
    | where Timestamp > ago(1d)
    | summarize arg_max(Timestamp, DeviceName, OSPlatform, MachineGroup) by DeviceId
) on DeviceId
| summarize Evidence   = count(),
            Raised     = min(AlertTime),
            Entities   = make_set(EntityType, 8),
            Files      = make_set(EvidenceFile, 5)
        by AlertId, Title, Severity, Category, DeviceName, OSPlatform
| sort by Raised desc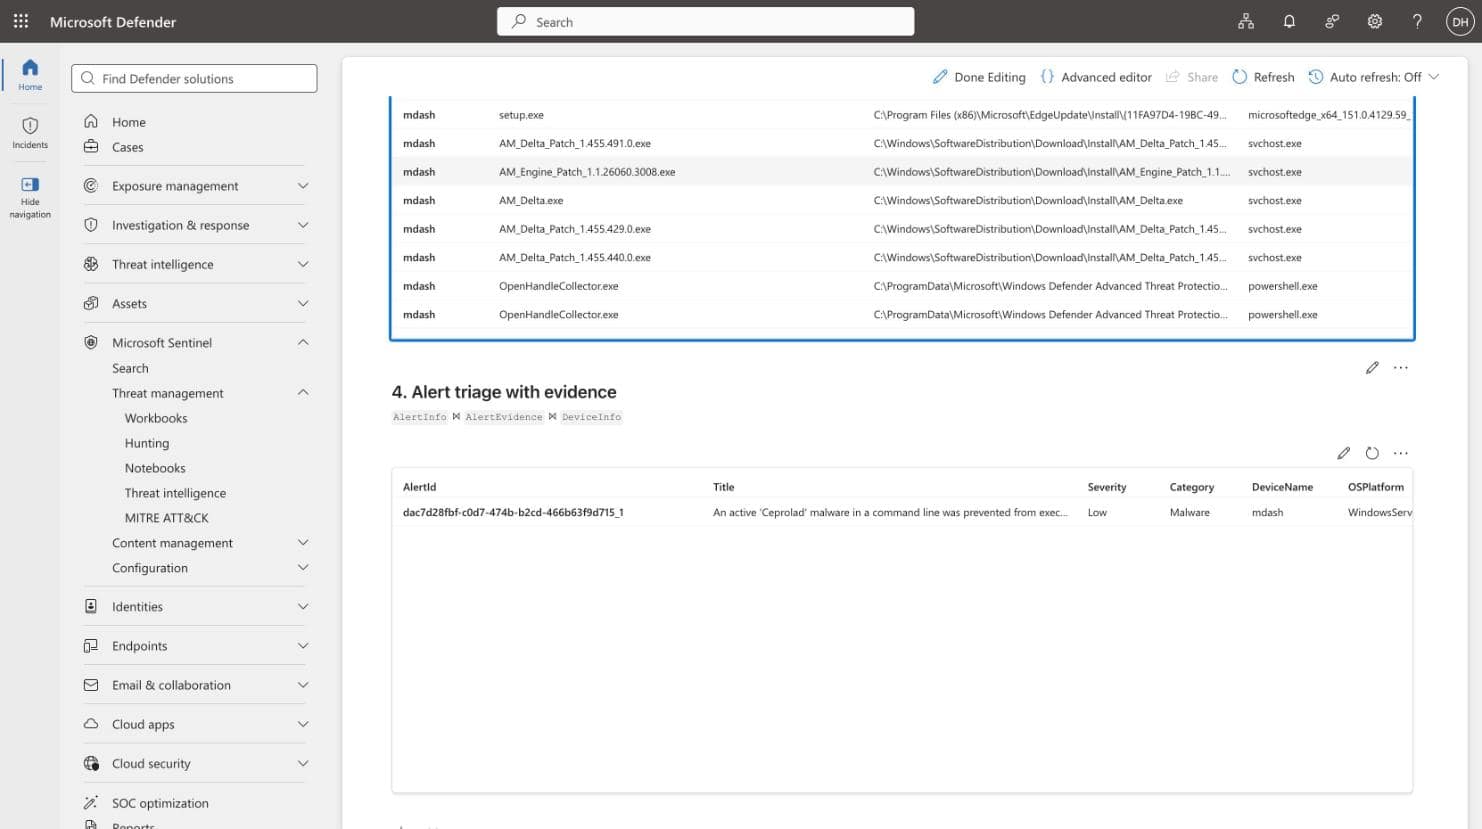
Under the hood
Open the Advanced Editor tab on any query step and you can see what the portal is actually writing:
{
  "type": 3,
  "name": "query-lolbin-egress",
  "content": {
    "version": "KqlItem/1.0",
    "query": "let lookback = 7d; ...",
    "size": 0,
    "timeContext": { "durationMs": 604800000 },
    "queryType": "advancedHunting",
    "crossComponentResources": [
      "/subscriptions/<sub>/resourceGroups/<rg>/providers/Microsoft.OperationalInsights/workspaces/<ws>"
    ],
    "visualization": "table"
  }
}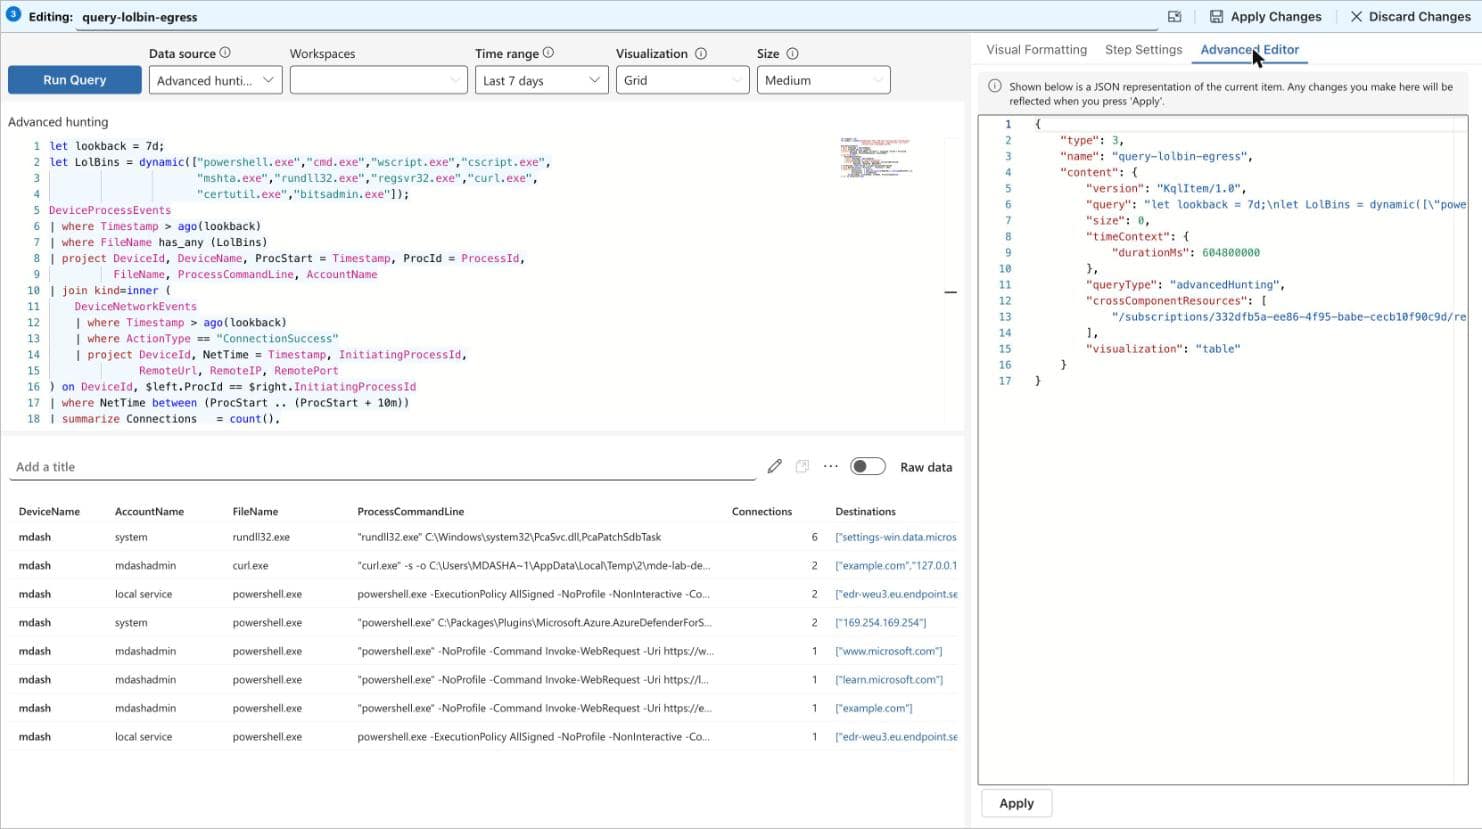
"queryType": "advancedHunting" is the whole feature in one line. If you manage workbooks as code — and with custom detections now supported in Sentinel repositories, more people should be — this is the property you set. Note that it is a string here; the classic workbook query types (Log Analytics, ARG and friends) are integers.
crossComponentResources carries the workspace scope that the Workspaces picker writes.
Things worth knowing before you build on this
Be explicit about time. Every step has its own Time range picker, and one of its options is literally Set in query. My advice: put an explicit ago() or between() filter in the KQL and treat the picker as a display convenience rather than the thing enforcing your scope. It makes the query portable — you can paste it straight into the Advanced hunting blade and get the same answer.
Advanced hunting retention still applies. The workbook does not extend it. You are querying the same 30-day window you get in the hunting blade, not a Log Analytics table with your custom retention policy.
The error message is misleading. When a query fails you get: “This query couldn’t run. If it uses Microsoft Sentinel data (for example the SigninLogs table), select a Sentinel workspace. Otherwise, the query may have an error — edit the panel’s KQL to fix it.” Nine times out of ten the workspace has nothing to do with it and you have a plain KQL bug. I lost a few minutes to exactly this — I was sorting by a column that my summarize had dropped. Paste the query into the Advanced hunting blade, where the error messages are specific, fix it there, then paste it back.
Mind your join cardinality. DeviceInfo, DeviceNetworkInfo and the other inventory-style tables emit repeated snapshots. Collapse them with arg_max() before joining or your row counts will quietly inflate.
Don’t mix schemas in one step. A step is either advanced hunting or Log Analytics. If you need SigninLogs next to DeviceProcessEvents, that is two steps in the same workbook, not one query.
Where this leaves us
The gap this closes is a real one. Advanced hunting has always been the fastest way to ask a question of endpoint telemetry, and workbooks have always been the easiest way to turn an answer into something you can hand to someone else. Until now, connecting the two meant paying to move the data. Now it is a dropdown.
With Sentinel in the Azure portal retiring after 31 March 2027, more of this kind of consolidation is coming. If you have been putting off the move to the Defender portal, features that only exist there are going to keep making the case for you.